Navigate Through Time‑Lapse Embryo View

The Embryo View organizes and controls the embryo's morphokinetic markers over time in frames. Like films, Embryo View divides the length of time into frames.
New to CATI: Learn more about the theory of morphokinetic markers.
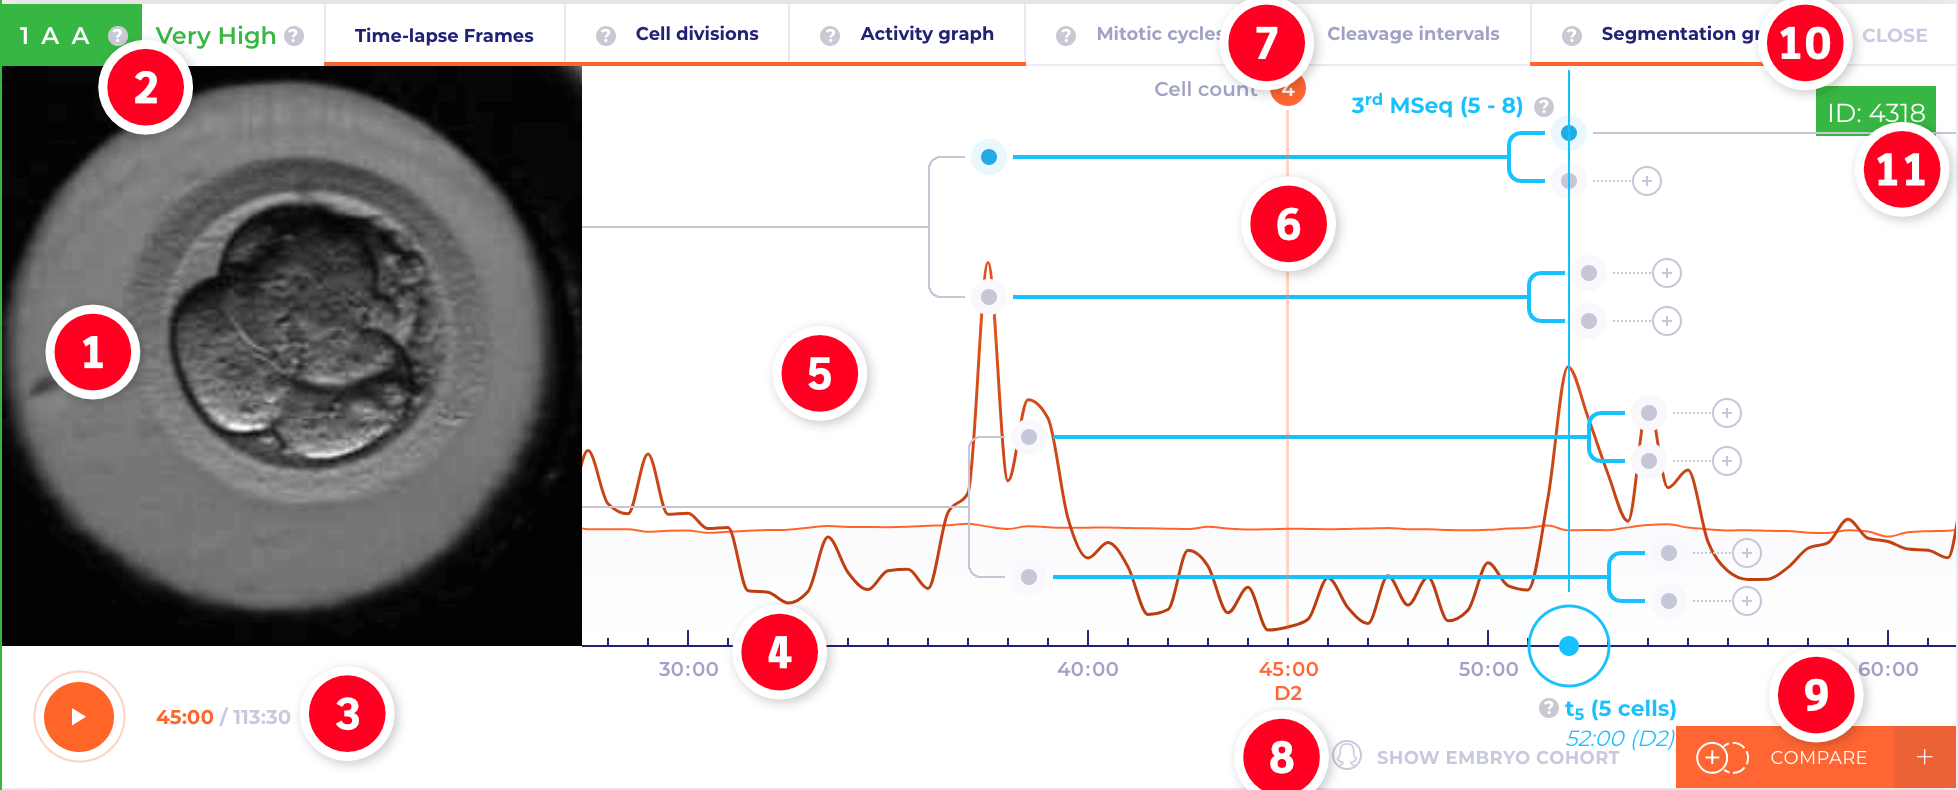
The Current Time Display
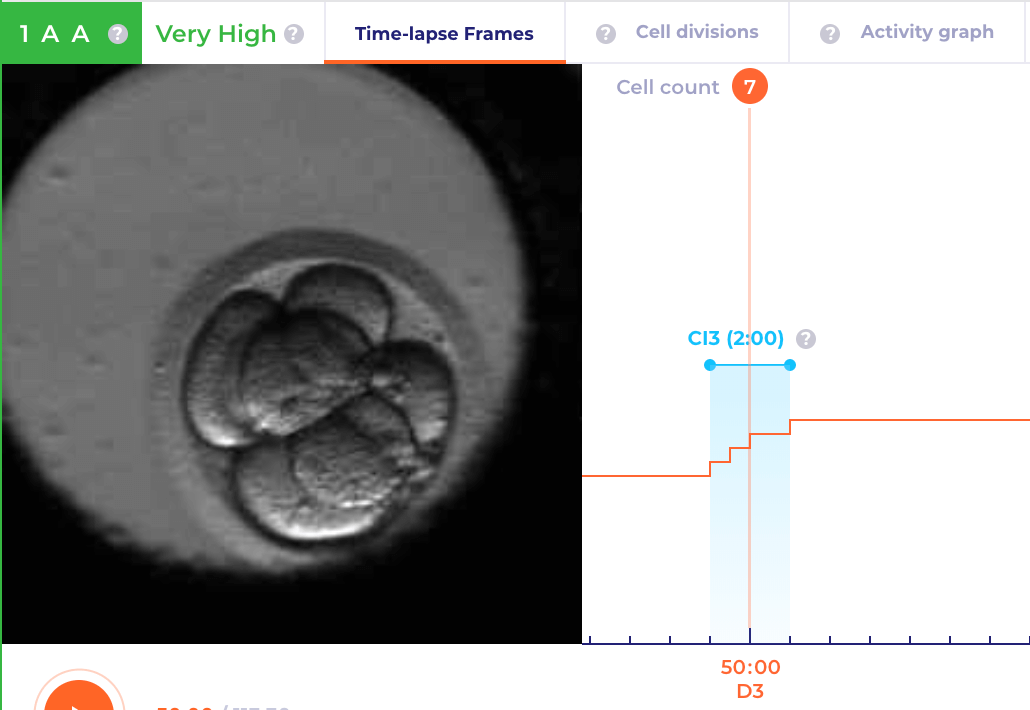
Shows the timecode for the current frame in the time‑lapse represented as the time from fertilisation. To move to a different time, place the pointer over the time ruler.
Playhead
Playhead indicates the current frame displayed in the time‑lapse. The playhead is an orange-colored time label in the ruler. A vertical line extends from the playhead to the top of the Graph area. The current number of cells is displayed on the top of the playhead's vertical line. You can change the current time by moving the mouse cursor.
Time Ruler
The Time-Ruler measures the time‑lapse sequence's time horizontally. Tick marks and numbers indicating the sequence time from fertilisation are displayed along the ruler. The time ruler also displays icons for markers and events according to the selected display mode. The next-nearest event is displayed as a blue circle.
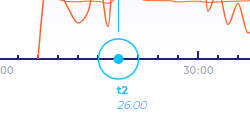
By dragging the ruler, you can scroll the visible part of the time ruler. When you drag the ruler, you are not animating the time‑lapse.
Graph Area
Displays a set of graphs representing the activity of morphokinetic markers according to the selected display mode. You can display all six modes at a given time point in the Graph Area.
By dragging the graph area, you can scroll the visible part of the graph area. When you drag the graph area, you are not animating the time‑lapse.
By placing the pointer over the left or right edge of the graph area, you can scroll the visible part of the graph area.
When the timebase of the time‑lapse differs from the ICSI timing, there is a blank space at the beginning of the graph area representing the difference of ICSI timing and the time‑lapse start time.
Morphokinetic Display Modes
Display modes section lets you hide or show time‑lapse image and viability morphokinetic marker graphs such as cleavage timing , cleavage intervals , mitotic sequence , segmentation graph , activity graph .
Time‑lapse Mode
Displays animated time‑lapse embryo photography. time‑lapse embryo photography is a series of microscope photos taken every 30 minutes. You can animate the time‑lapse by clicking on the Play Button or by hovering the mouse cursor over the Timeline or the Chart Area. To move the time‑lapse backward, move the mouse cursor to the left and vice-versa.
The time‑lapse, the Graph Area and the Timeline are animated simultaneously.
Cell Divisions Mode
Displays a binary tree representing series of the cleavages .
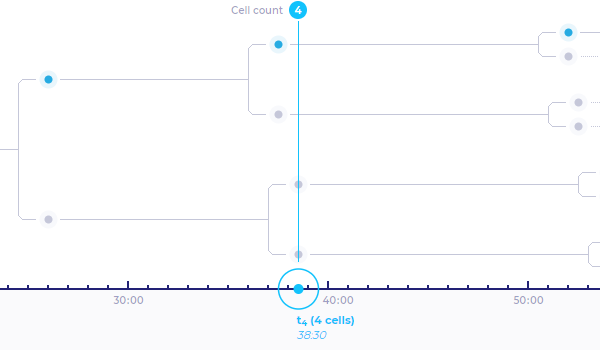
Parts of binary tree which are highlighted in light-blue color represent mitotic sequences
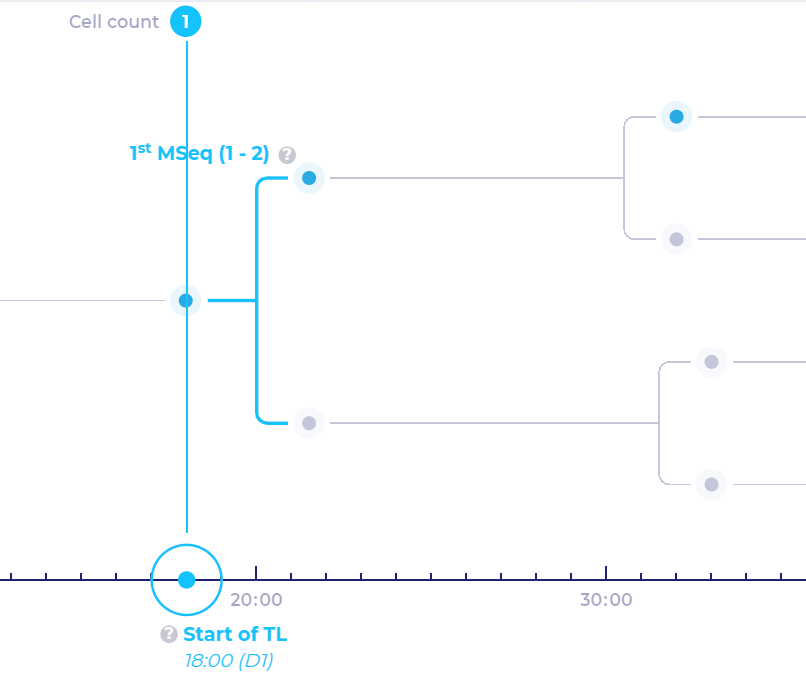
Because of the limited capabilities of time‑lapse Imaging systems, the most top node is used to display mitotic sequences.
Activity Graph
Displays a graph of the activity . The horizontal axis of the graph represents time from fertilization and the vertical axis represents the output level of cell activity.
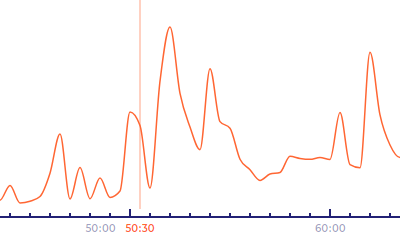
Segmentation Graph
Displays a graph of the segmentation . The horizontal axis of the graph represents time from fertilization and the vertical axis represents the area of the embryo inside the zona pellucida (in px).
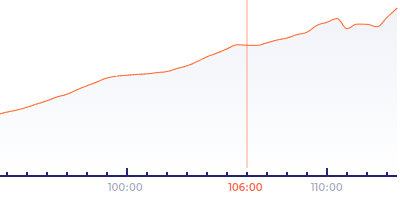
The edges of the line segments display circle symbols that indicate the timing of three morphokinetic markers indicating embryo’s ability to hatch — blastocoel expansion , blastocoel collapses and mitotic pulses .
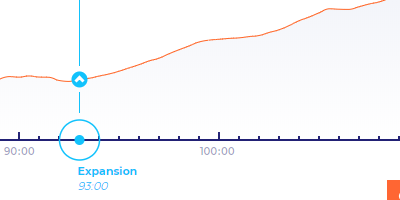
Start of Expansion
Start of blastocoel expansion is displayed as a circled upward-arrow symbol. The horizontal position of the symbol indicates the time when expansion starts. The vertical position of the symbol indicates the volume of the area of the embryo.
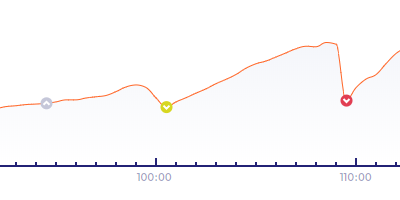
End of Collapses and Mitotic Pulses
Blastocoel collapse or mitotic pulses are displayed as a circled downward-arrows symbol. The horizontal position of the circle indicates the time when expansion starts. The vertical position of the symbol indicates the volume of the area of the embryo. The symbol color varies by collapse type.
Mitotic Cycles
Displays mitotic cycle
represented as horizontal bars. Caption above the bar indicates the name of the mitotic cycle. The mitotic cycle bar is grey by default and the bar gets highlighted in light-blue color when the playhead position matches the mitotic cycle time range.

Cleavage Intervals
Select this mode to display cleavage intervals calculations. As the mitotic sequences, these are represented as horizontal bars. Caption above the bar indicates the name of the cleavage interval. The cleavage interval bar is grey by default and the bar gets highlighted in light-blue color when the playhead position matches the cleavage interval time range. Cleavage step-line chart is displayed along the bars, the chart is represented by a series of cleavage timings. The horizontal axis of the graph represents time from fertilization and the vertical axis represents the number of cells currently monitored.
Embryo Day‑Five Grade
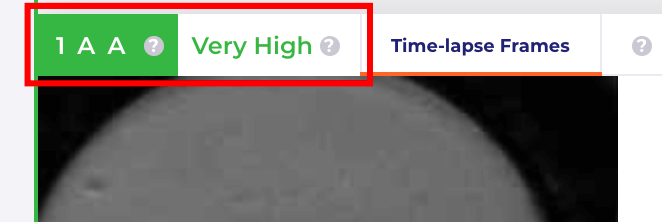
Shows the grade (e.g. 1AA) and its implantation potential according to Day‑Five Embryos Grading System methodology. The grading is at the upper left corner of embryo view.
Compare to Other Embryo
Time‑lapse embryo comparison allows you to compare different time‑lapse embryo images side by side. Learn how to do it.
